Scratchers Sales
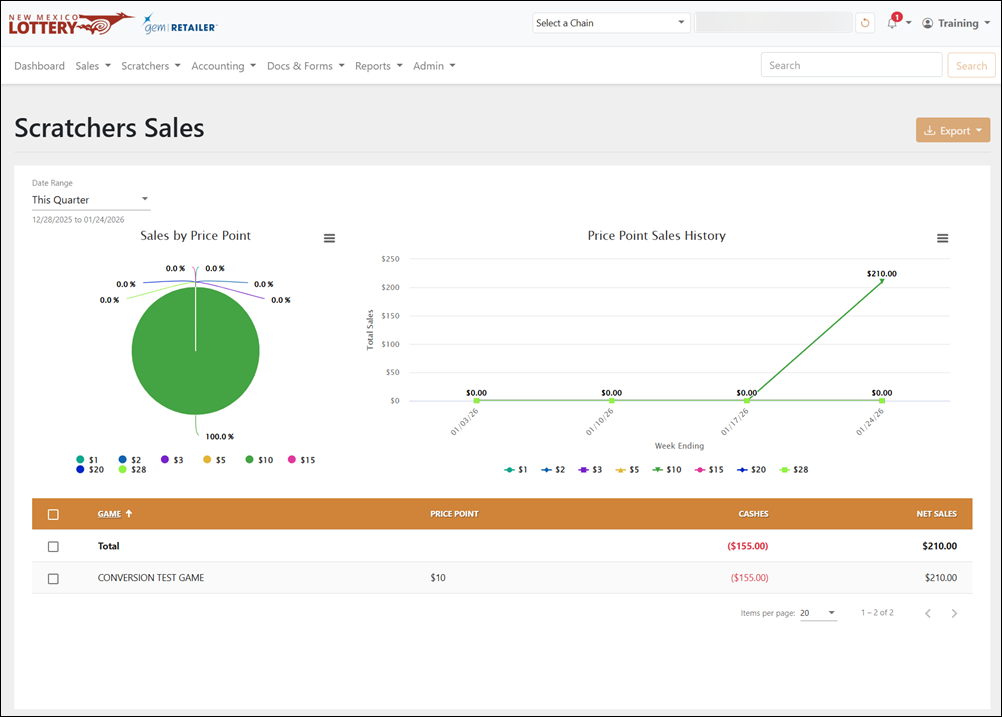
The Sales > Scratchers Sales page displays sales data in charts and a table. At the top of the screen, you will see two charts above the data table: Sales by Price Point, and Price Point Sales History and Game Category Sales History.
 Sales > Scratchers Sales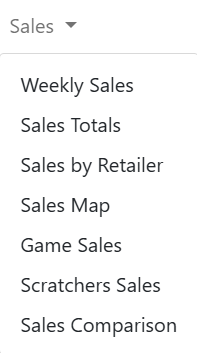
NOTE: To view data, you must select a chain and/or retailer at the top of the page. If you only select a chain, it displays the details for all of its retailers. You may also need to change the date range if applicable.
Date Range
For the Date Range, you can also select Custom to choose your own date range. Below the charts, use the table to view sales details for each game and price point that match the selected filters.
Sales by Price Point
The Sales by Price Point pie chart displays the percentage of total sales for each Scratcher game price point based on the selected filters. Hover over a price point to display the total sales amount.
Price Point Sales History
The Price Point Sales History chart displays net sales over time. Net sales appear on the Y-axis, and the weekending date appears on the X-axis. Each line represents a Scratcher game price point. The chart displays data based on the selected filters. Hover over a point to display the sales amount for that week and price point.
Export Sales
To export, select the items to export, click [Export] on the right-hand side, and choose the file format. You can also check the orange checkbox at the top of the results to select all the items.