Sales Comparison
The Sales > Sales Comparison page allows you to compare sales by week using either a line chart or a table. Net sales display on the Y-axis, and the week-ending date displays on the X-axis. Hover over a point on the chart to display the sales amount for that week.
 Sales > Sales Comparison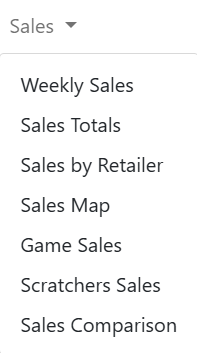
NOTE:To view data, Corporate and Lottery users must select a chain and/or retailer at the top of the page. If you only select a chain, it displays the details for all of its retailers. You may also need to change the date range if applicable.
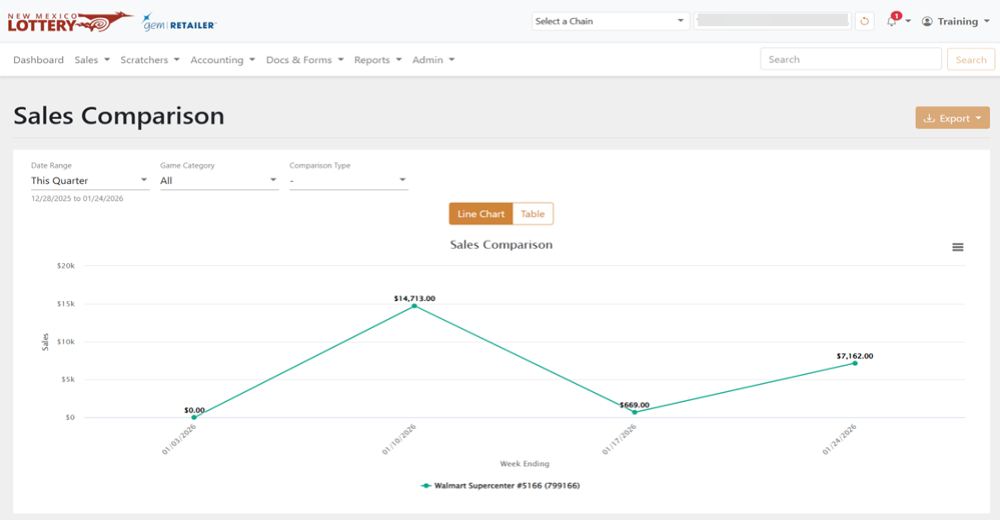
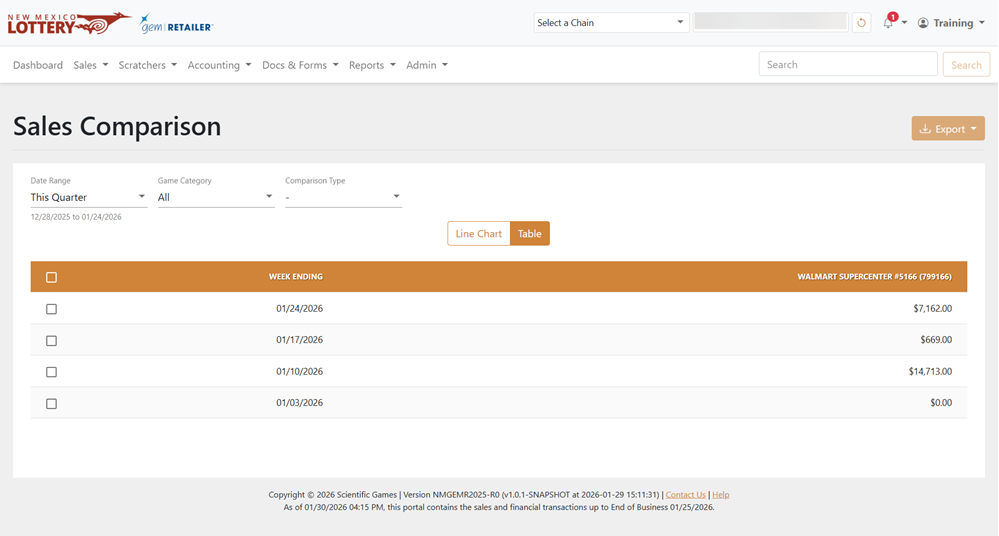
Filter Results
To filter results, use the available date fields and dropdown menus to filter the data in the results table. For the Date Range, you can also select Custom to choose your own date range. To change your comparison view, use the Comparison Type dropdown menu. Some options in the Comparison Type dropdown menu trigger an additional field to appear, such as the Territory option.
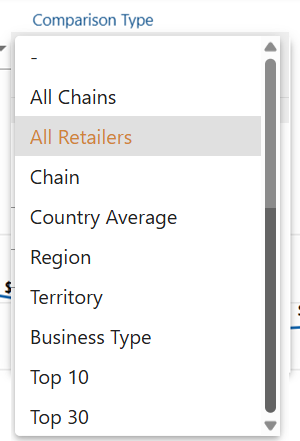
Chart Options
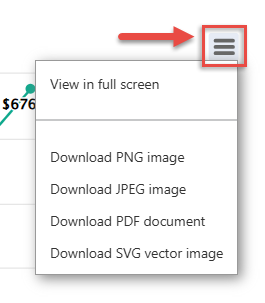
Click [Line Chart] to view in a line chart or [Table] to view in a table. For the line chart, click the Chart Context menu on the right-hand side to view in full screen, print the chart, or other graphical download options.
Export Game Sales
To export, select the items to export, click [Export] on the right-hand side, and choose the file format.